"GLOBAL CHANGE ECOLOGY"
We are living in an era that many are calling the “Anthropocene”—a period in which humans and their activities along with ongoing environmental changes rapidly transform almost all ecosystems on the planet. Our research under this theme combines diverse approaches (e.g., field experiment, biogeochemistry, microbial ecology, biophysical modeling) to provide a fundamental and holistic understanding of the effects, consequences, and mechanisms of global changes on ecological systems. In particular, we focus on linked above- and below-ground functions and how their interactions shape the dynamics and ecosystem-level responses to global change factors in agricultural systems that include changing precipitation, land intensification, and altered disturbance regimes. Findings from our research inform solutions for global change mitigation and adaptation.
(1) Interactive Effects of Climate Change, Land Intensification and Grazing on Grassland Multifunctionality
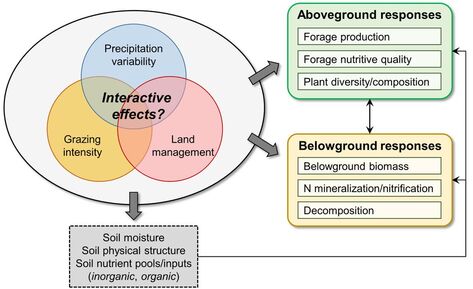
A current global challenge is to foster sustainable and long-term resilient agroecosystems in the context of increasing climate variability. Through a USDA NIFA-funded project, we ask two foundational research questions: (a) Given projected shifting rainfall variability, how will alternative grazing intensity and land management interact to affect multifunctionality of subtropical grasslands? (b) Can deliberate manipulation of grazing intensity serve as an adaptation strategy to enhance climate resilience of grasslands used for beef cattle production? To address these questions, we used a three-way factorial design to experimentally manipulate precipitation variability and grazing intensity along the land intensification gradient in subtropical humid grasslands. The work utilized a multifunctional approach and focus on above- and below-ground ecosystem functioning and services, including forage productivity and quality, plant diversity and other regulating services. Knowledge gained from this project will provide vital information for resilience and sustainability of subtropical grasslands.
|
FIGURE 1. Conceptual diagram of interactive effects of precipitation, grazing and land management on above/below-ground functions.
|
|
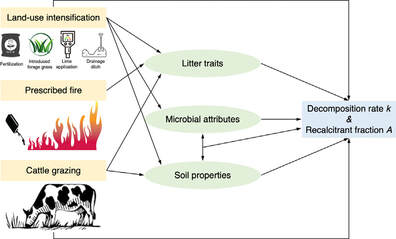
(2) Land Management, Fire, and Grazing Disturbances Effects on Wetland Functions and Services
Geographically isolated wetlands provide critical ecosystem services such as flood protection, carbon sequestration, nutrient retention, water purification, and biodiversity support. In tropical and subtropical regions, numerous isolated seasonal wetlands are embedded across agricultural landscapes. Although these wetlands do not occupy a large proportion of the land surface, they are widely distributed across the landscapes, and function as hotspots of ecosystem services and indispensable environmental buffers between agricultural lands and natural areas. However, global change drivers (e.g., land-use intensification and altered disturbance regimes) have substantially modified the structure, functioning, services of these wetlands, which remain less well understood. Hence, it is crucial to investigate responses of these geographically isolated wetlands to global change drivers and explore key underlying mechanisms to inform effective and sustainable land management. Throughout a multi-year research project building upon a long-term whole-ecosystem and factorial wetland experiment in central Florida, we have examined interactive effects of land management, cattle grazing, and prescribed fire on organic matter decomposition (one of the most fundamental processes underpinning a range of ecosystem functions and services), greenhouse gas fluxes, and microbial communities, and tested for underlying biotic and abiotic mechanisms. Based on these work, we am scaling up local, mechanistic understanding to regional watersheds to address how alternative management scenarios can influence grassland-wetland resilience to future climate changes, and what institutions are required to support such shifts in landscape management.
|
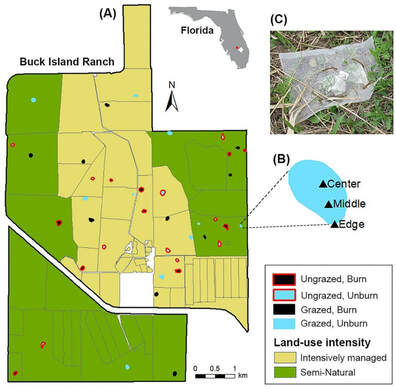
FIGURE 2. (A) Map of 40 wetlands in a whole-ecosystem experiment in Buck Island Ranch of Archbold Biological Station (USA). (B) Sampling sites along the hydrological gradient. (C) Photo shown as an example of tea bag and litter bag in the field to measure decomposition.
|
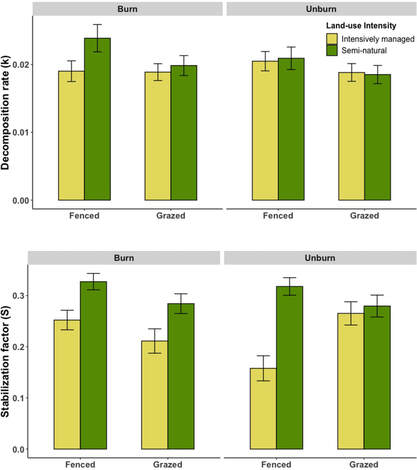
FIGURE 3. Differences in (A) decomposition rate k and (B) stabilization factor S across treatments (Guo et al. 2021).
|
|
FIGURE 4. Direct and indirect pathways of land management effects on wetland decomposition (Guo et al. 2023)
|
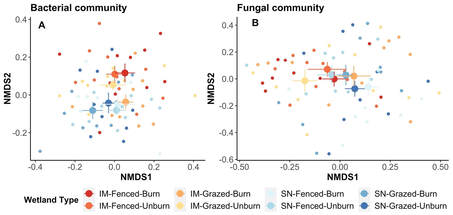
FIGURE 5. Nonmetric multidimensional scaling ordinations of bacterial (A) and fungal (B) among land-use intensity, grazing and fire treatments. (Guo et al. in review).
|
(3) Land Intensification and Soil Legacy Phosphorus in Grasslands
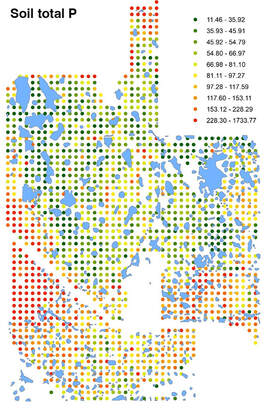
Freshwater eutrophication caused by phosphorus (P) enrichment is a stubborn environmental problem throughout the world, in particular in human-dominated watersheds. It is characterized by reduced water clarity, and occurrence of algae blooms, leading to substantial losses in ecosystem services (e.g., beach closure, reduced recreation and nature viewing) and economic benefits (e.g., fish death, declined tourism revenue). In the central-south Florida, for example, much of the landscape is dominated by agriculture with historical P applications. Research showed that even decades after P fertilization ceased, P loadings in runoffs were still five to seven times higher due to legacy effects. Hence, it is crucial to assess the magnitude of soil legacy P, their sources and spatial variability, and explore best management strategies (BMPs) that harness P losses and mitigate their impacts on downstream water quality. In a collaborative research project funded by FDACS and South Florida Water Management District, we aim to: (1) quantify spatial variability of soil legacy P and their responses to land intensification; (2) evaluate factors contributing to soil legacy P and predict future losses in soil P under changing climate; (3) assess the role of AMF in P cycling in subtropical grasslands; and (4) investigate effectiveness of BMPs on reducing P losses and removing P, and how effects vary with climate variability.
Sample Publications
- Guo, Y., Boughton, E., Liao, H.L., Sonnier, G., Qiu, J. 2022. Direct and indirect pathways of land management effects on wetland plant litter decomposition. Science of the Total Environment 854: 158789. (pdf)
- Guo, Y., Boughton, E., Qiu, J. 2021. Interactive effects of land-use intensity, grazing and prescribed fire on subtropical wetland decomposition. Ecological Indicators 132: 108301. (pdf)
- Guo, Y., Liao, H., Boughton, E.H., Martens-Habbena, W., Qiu, J. (In revision). Interactive effects of land-use intensity, grazing and fire disturbances on soil bacterial and fungal communities in subtropical wetlands. Agriculture, Ecosystems & Environment.
- Qiu, J., Queiroz, C., Bennett, E.M., Cord, A.F., Crouzat, E., Lavorel, S., Maes, J., Meacham, M., Norström, A.V., Peterson, G.D., Seppelt, R., Turner, M.G. 2021. Land-use intensity mediates ecosystem service tradeoffs across regional social-ecological systems. Ecosystems and People 17(1): 264-278. (pdf)
|
|

|
|